A Visual Experiment at the CRC
The CRC 1265 is currently experimenting with visual methods of analysis. This blogpost presents one such experiment. In this experiment, preliminary research findings were transformed into graphics by a designer, thus setting in motion an image-based process of discovery and reflection. It is shown how such a short-term collaboration between social science and artistic design has been carried out and what kind of potential it brought with it.
Context: Interdisciplinary Methods Program in the Methods Lab of the CRC 1265
Séverine: As part of the interdisciplinary methods program of the CRC 1265, we set out to foster cooperation between sociologists and designers. The intention behind such interdisciplinary collaborations is a novel enrichment of research processes that deal with space (see also the work of the Hybrid Mapping Methods working group).
The joint production of concrete visualisations of research findings has proven to be vital building block for such cooperation. We were interested in experimenting with how we could weave visualisations into the process of analysis (and not just in the survey or presentation of results) in order to reveal to researchers the often implicit workings of their argumentation. Social science disciplines have long worked conceptually with diagrams, mind maps, or cartoons, but visual skills are usually too limited to synthesise one’s complex working hypotheses in more abstract and pointed ways.
Based on this challenge, the idea of a visual task force at the CRC came up within the framework of the Methods Lab. Precisely because many research projects are not always able to guarantee an interdisciplinary team constellation, such a visual task force could potentially provide a profitable balance. We therefore wanted to conduct an experiment to see what the outcome would be if sociologists committed themselves to rely on the external expertise of designers of spatial visualisation techniques.
1. Experiment: Starting Point
For the experiment we needed a sociologist and an equally open-minded designer. Fortunately, I was able to convince CRC researcher David Joshua Schröder to join us and get involved in this small experiment. At that time, he was approaching the end of his dissertation. I then looked for a graphic designer/artist with explicit references to space and a willingness to enter a sociologist’s analytical and theoretical process.
The request was formulated as follows:
“We are looking for a science illustrator to cooperate with a research project in spatial sociology. The research project investigates the change of control centers since the 1970s from a spatial perspective (see project page: B02 of the CRC 1265 at the TU Berlin). In close exchange with the project staff, the aim would be to produce two visualisations:
- a typology of spatial arrangements in the control centers since the 1970s;
- a visualisation of the spatial relations between inside and outside, i.e., how the observed places outside the center are represented in the inside structure of the center.”
Joshua and I were fortunate to find the architect and drawer Luca Mule, who happily agreed to work closely with Joshua to produce an ‘image’ of Joshua’s theses. As a commissioned work, the request was precisely formulated and structured by certain steps. However, such a task cannot be done under pressure, but required space and time for deep empirical and theoretical discussion between the two. But now I’ll let Joshua tell the story himself!
2. Procedure of the Experiment
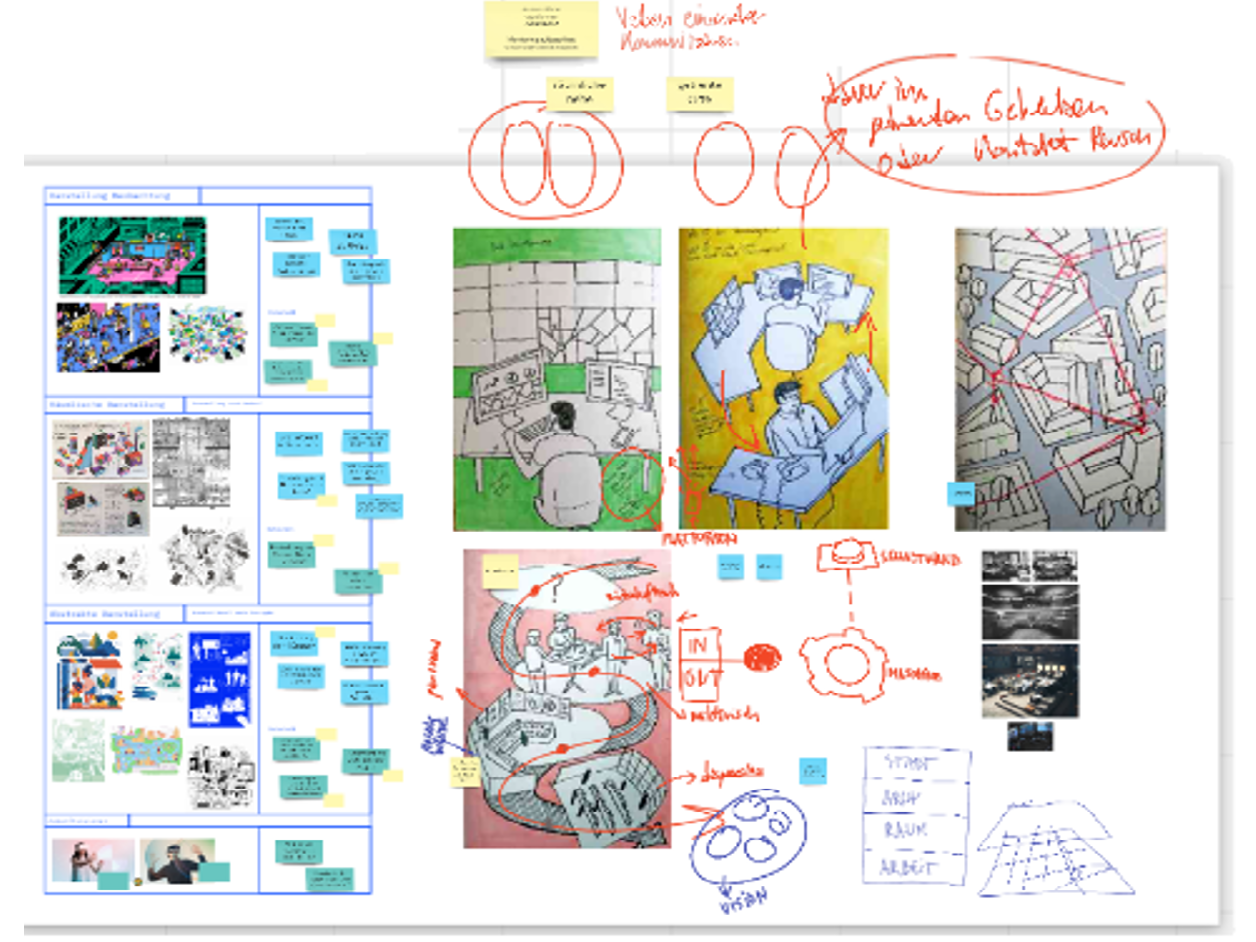
Joshua: In the first session, I presented my argumentation to Luca in (I tried my best!) non-jargon and mundane language. Luca constantly followed up on this and approached my topic in his own way. This exchange with someone who has no background in sociology was already helpful in making explicit the hidden ‘gordian knots’ of my thoughts, which I would have to cut to make my arguments more consistent. It was important to us that Luca did not take up the visualisation ideas I already had (which might also have been exciting) but developed his own images from my stories. In this way, we wanted to avoid the collaboration flattening out into a mere illustration. To get started, however, I had collected some notes and photos (Figure 1).

In the second session, Luca presented his associations and drafts to me, which then became the basis for further discussions. His interpretations and sketches brought out new ideas, questions, discrepancies, and gaps in knowledge, which not only led to a constant adjustment of the visualisations, but at the same time to a sharpening and correction of the argumentation. Figure 2 shows a concrete example of the attempts to visualise my findings. In this particular case, I described to Luca how new control centers of urban infrastructure nowadays frame the control of urban space. Following this, metaphorical images such as hot wire, a lift, maze, a puppet, and dressage came up. In the end, none of them were used, but they have still been helpful in sharpening my argument.

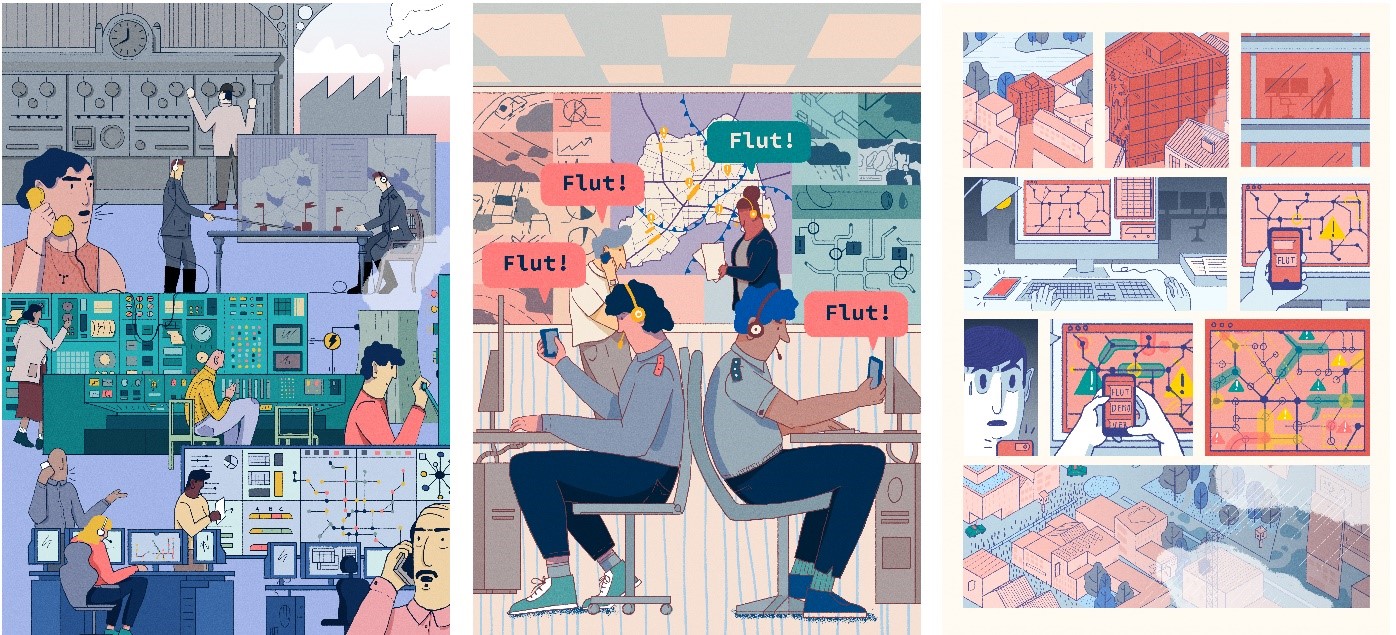
Also, thanks to this sharpening, my final argument now ultimately boils down to a new imagining of spatial control that no longer merely seeks to divide the urban space by functions in a manner similar to ‘systems theories,’ but focuses more on the ‘holistic’ composition of events in urban space – as illustrated in Figure 4 on the right. Sketchy drafts slowly became fully developed graphics over the course of the sessions. Figure 3 shows a more elaborated part of the process. Much more important than the graphic result itself, however, was the extremely helpful opportunity to translate one’s own thoughts into pictures with the help of others, because this forced me to formulate my arguments or theses more pointedly.
The method may therefore be useful at the later stages of the research process, i.e., at a time when clear theses have already emerged, but these theses are not yet fully developed. The process helps to clear up previously undetected misunderstandings, to recognise connections and questions that one had not identified yet and thus to sharpen the contours of the theses. Visualisations force researchers to be vividly concise.

The collaboration did not just take place between me and Luca alone; other researchers were extremely helpful here as well – but because this needed to be a very playful exchange of ideas, the involved group had to remain small enough for a loose, low-threshold, and less formal exchange to take place. Reflective silence, failed thought experiments and dead ends should be atmospherically welcomed. Figure 4 shows the results of the collaboration.

3. Reflection and Dissemination of the Approach
Séverine: The experiment was successful. The collaborative production of the three visualisations enabled Joshua to formulate his thesis more precisely. First and foremost, the visualisations were helpful for the analysis. Beyond that, they can now also appear as a representation of the results in a book, or be used for other forms of science communication.
The experiment makes it clear that we should promote such collaborations at a low threshold and expand them further in the second phase of the CRC. In the first year of the CRC’s second phase, we will, for example, collaborate with the artist Nikolaus Gansterer within the framework of the so-called theory tandem. Based on his practice of situational notation, he will explore the dynamic spaces between drawing, thinking, and acting together with the CRC’s subprojects.
Author Information
Séverine Marguin (Dr.) is a sociologist of space and culture and head of the methods lab in the Collaborative Research Center 1265 “Re-Figuration of Spaces” at the Technische Universität Berlin. She is currently completing her habilitation on the relationship between sociology and design. She leads the CRC subproject C06 “Streaming Series: Spatial Stories and the Production Regimes of West African Afronovelas”.
David Joshua Schröder (Dr. phil.) is a research associate at the Institute of Sociology at FAU Erlangen-Nuremberg. He completed his doctorate at the Collaborative Research Center 1265 “Re-Figuration of Spaces” working on transformations that have taken place in control centers since the 1970s.

